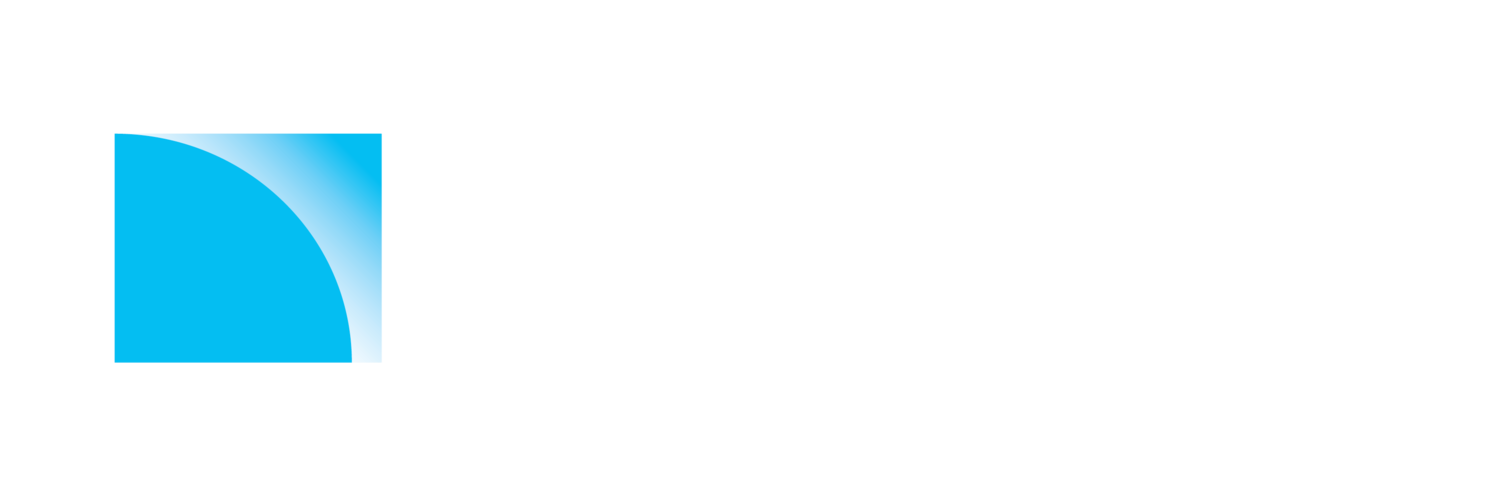

With just a few clicks in your map viewer, you can export data for use in reports, presentations, and other familiar software like Excel, PowerPoint, and ArcGIS. This data allows you to take the power of AssetAlly into your organization. Learn how to make the most of your AssetAlly data in this easy to follow tutorial.
6 Important Questions to Ask Before You Select a GIS

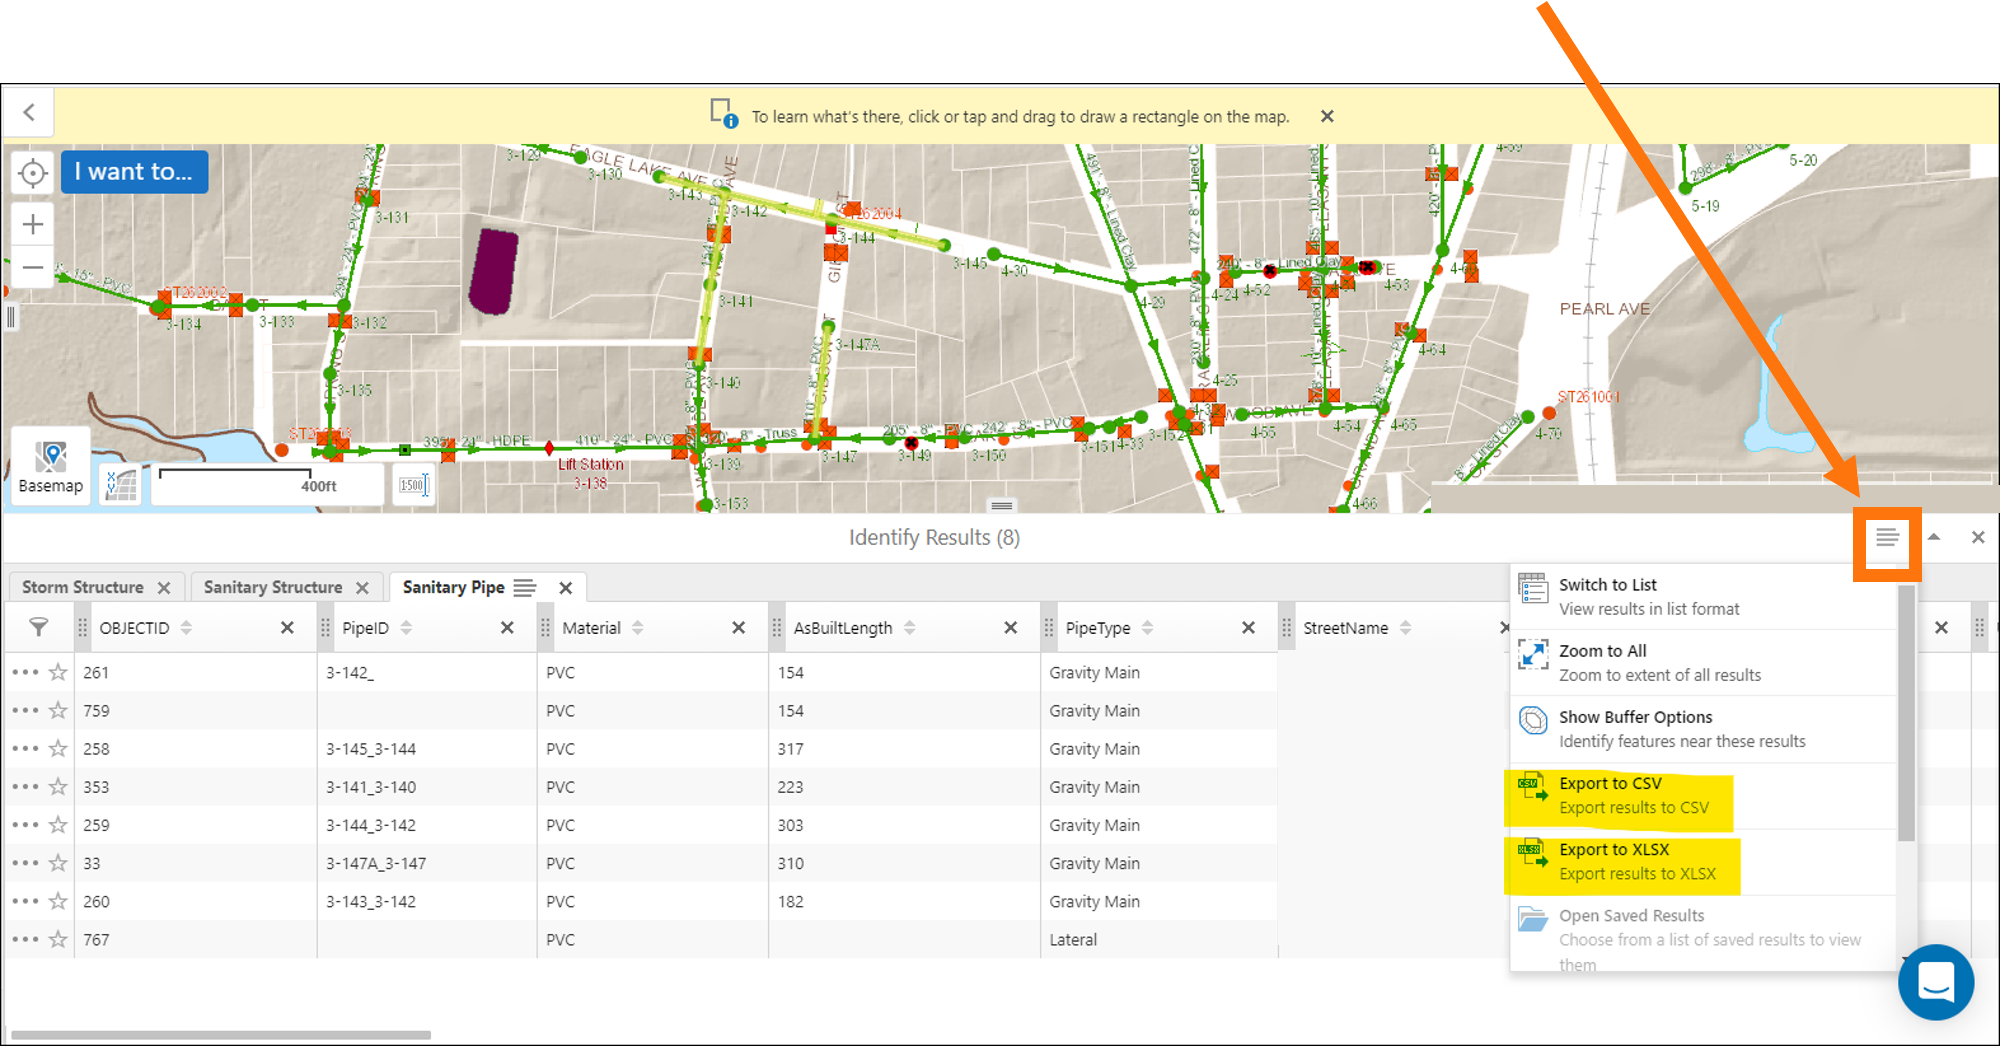
How AssetAlly Can Help Your Community Prep for Spring

Spring has sprung! Well, maybe not quite yet... but it’s getting closer! Winter can be a chaotic time of year for municipalities dealing with snow removal, frozen pipes, property damage from snowplows, and more. Learn how AssetAlly can help your municipality prepare for spring and get the most out of your GIS by completing sign inventories and performing inspections when cleaning infrastructure.
New Year, New Newsletter, New Events!

Welcome to our new and improved AssetAlly newsletter! Formerly distributed through our website directly, we hope you’ll look forward to receiving helpful monthly user tips, updates on new features, frequently asked questions, and other valuable info related to your GIS directly to your inbox each month. To start, here’s a few of the events we’re most looking forward to in 2020!
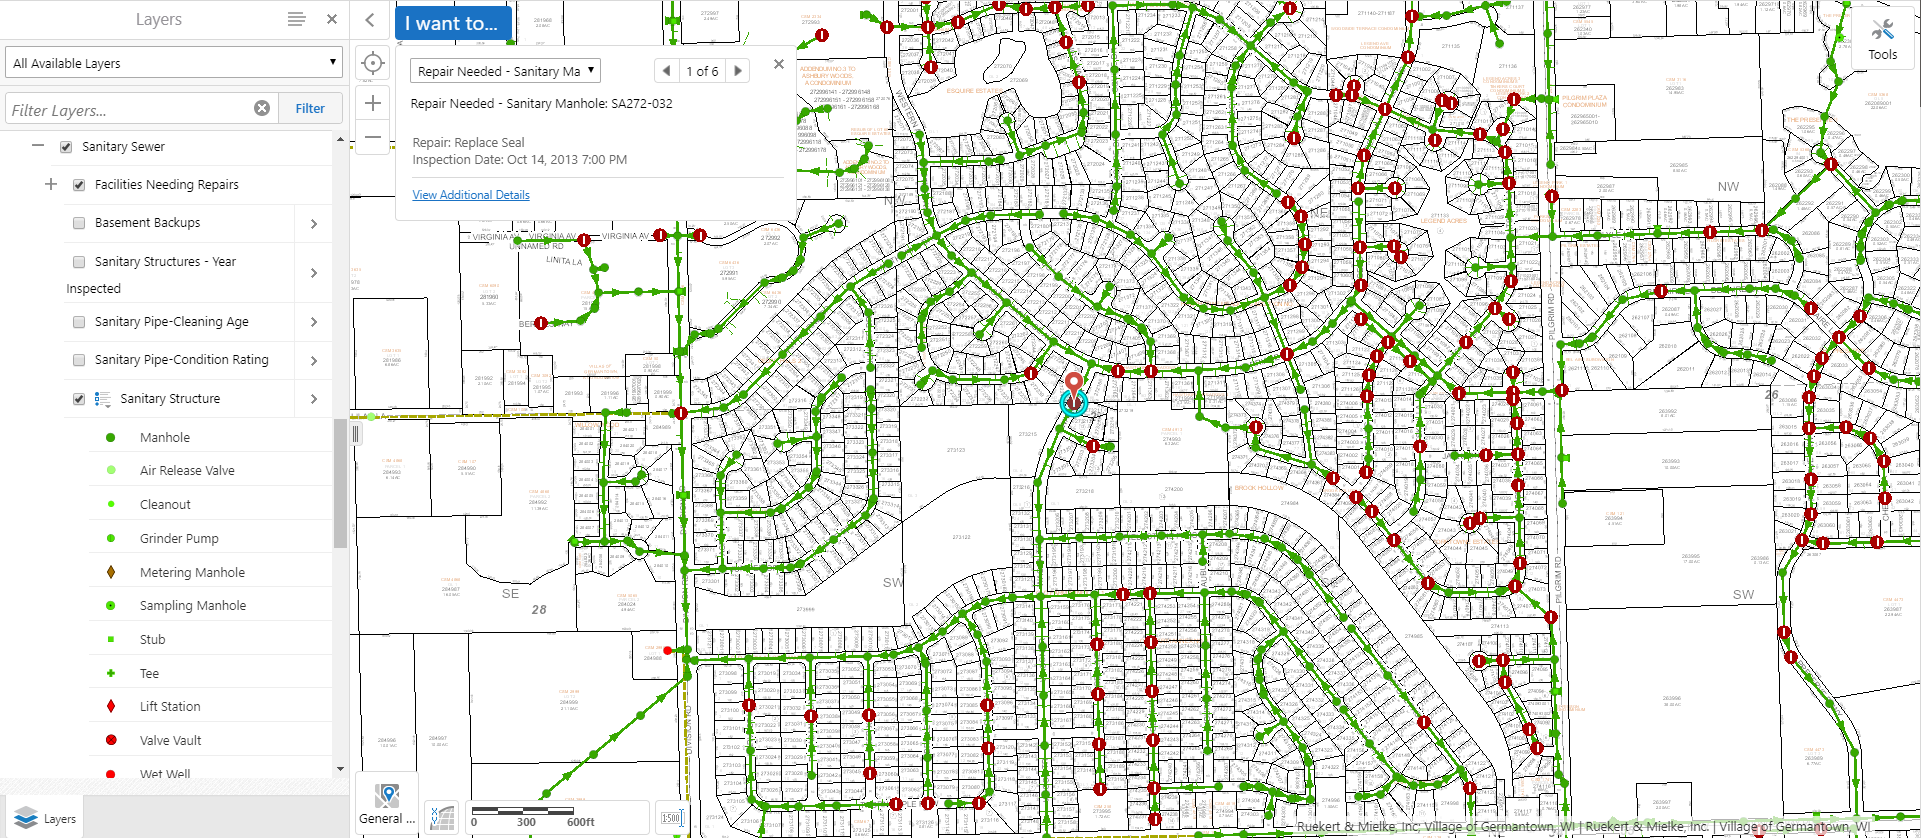
Getting Started With AssetAlly
2019 Can't-Miss GIS Events

Getting Started With AssetAlly
GIS Cheat Sheet for End of Construction Season Planning

Exporting Your Map as an Image

GIS & CIA

Table View vs. List View

When identifying features, you have the ability to view your data in a tabular Excel-like format without leaving your map. In this article we'll identify some sanitary structures and then demonstrate how to switch between the List and Table views available for displaying results. We'll first turn on the targeted layer--in this case, our sanitary layer--and use the rectangular identify tool to select a group of sanitary features to observe in our results window.
