Learn how the Village of Hartland cut costs by using AssetAlly to more efficiently manage their sanitary sewer main televising and cleaning program.
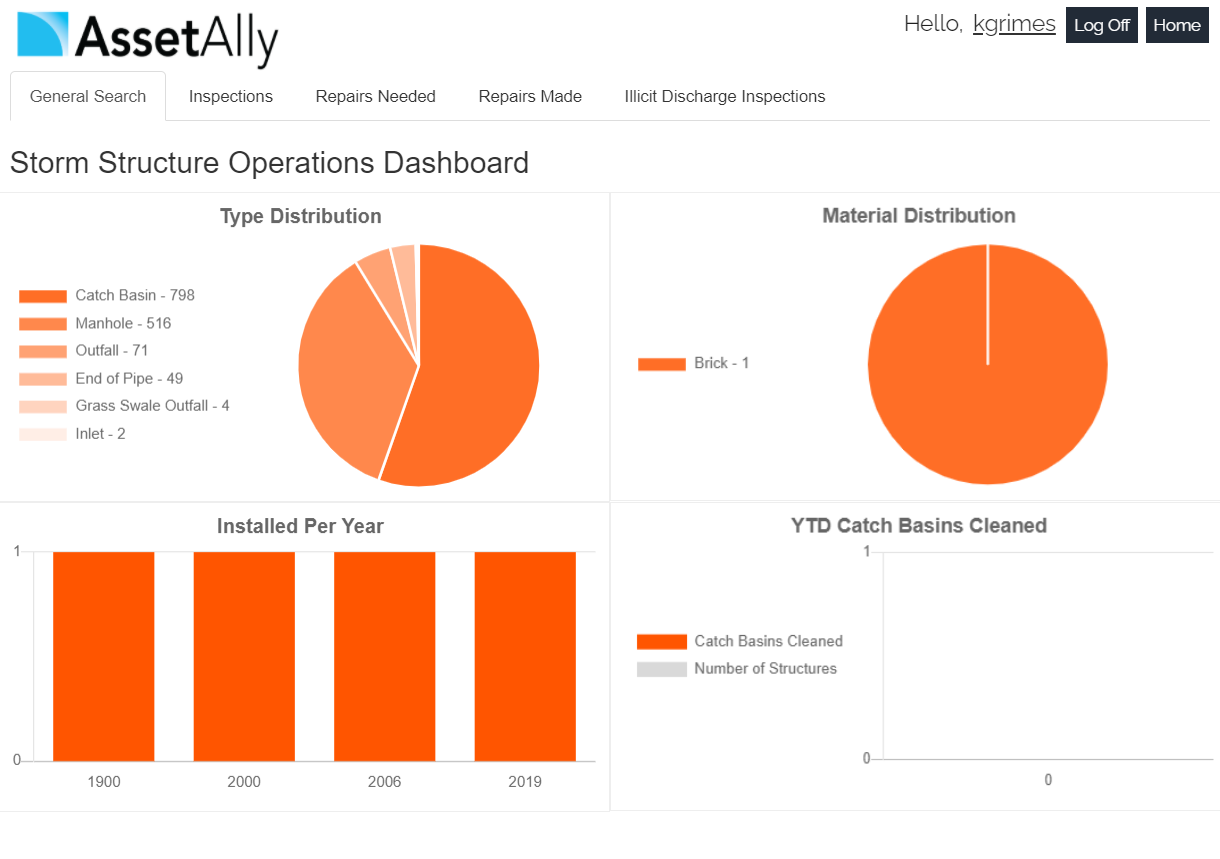
Meet Your New Operations Dashboards: View Progress, Goals, and Data At-a-Glance
AssetAlly now includes new Operations Dashboards that give you an instant graphic overview of important community data like your team’s current workload, annual routine maintenance progress, and other essential infrastructure statistics. Learn how this new feature will help you spend less time crunching numbers and more time improving your community.
The Map Gallery and Your Frustration-Free Future
4 Ways AssetAlly Can Help Maintain Your Sanitary Sewer System
Streamline your Processes: The Manhole Inspection Tool
Manholes are the primary points of access to your community’s underground infrastructure. The AssetAlly Manhole Inspection Tool streamlines the inspection process, giving your team portable, digital access to previous inspection data and the ability to efficiently complete new inspections on-the-go.
4 Ways AssetAlly Helps Maintain Your Sanitary Sewer System
Improve Your Budgeting Process by Calculating Sanitary Sewer Lengths
How to Keep Up To Date With Your Sanitary Sewer Cleanings
Symbolizing Sanitary Pipes By Material
Today we will be showing you another fun way in which we are able to use the "Turn on/off layer visualizations" for symbolizing various attributes on your utilities. In our example today, we will be visualizing the sanitary pipes in our GIS based off of their material makeup. The first step is turning your sanitary pipe layer on. We will then click on the arrow next to the item in the layer list.


